Roll your covered calls
without the spreadsheet chaos.
ROLL.OPS is a focused, educational terminal for income traders. You enter your own positions and model rolls by hand using real, 15-minute-delayed market data — no broker connection. This page shows exactly how it works, then sends you into the live app.
/ What is ROLL.OPS
A command center for selling and rolling covered calls.
ROLL.OPS is built for income traders running the wheel and covered call strategies. It's an educational workspace: you manually enter your positions, model different rolls, and learn the mechanics — without ever connecting to your bank or brokerage.
/ What "rolling a covered call" means
Rolling means you buy back the call you previously sold and, at the same moment, sell a new call against the same shares — usually at a different strike or a later expiration. For now, ROLL.OPS focuses only on covered calls — nothing else.
/ Real data — not simulations
Even though ROLL.OPS never connects to your account, nothing here is fake. Every analysis is built from your actual position inputs and live option prices from Yahoo Finance — real market data on roughly a 15-minute delay.
01 / Manual & Private
Every position is entered by you
ROLL.OPS never connects to your bank or brokerage. You enter your covered calls by hand, so your money, logins and personal financial data stay entirely yours.
02 / Scenario Modeling
Test rolls before you trade
Model different strikes, expirations and premium targets to see how a roll would play out — then decide on your own terms.
03 / History Log
Every move is logged
Each roll is saved to your history as its own entry — a record of what you did, not a running total. Heads up: experiments you make can show up there too.
04 / Educational by design
Learn the mechanics, stay in control
A hands-on learning terminal for income traders. You plan and place every roll yourself, so you understand exactly what you're doing and why.
/ Inside the terminal
See what you're working with.
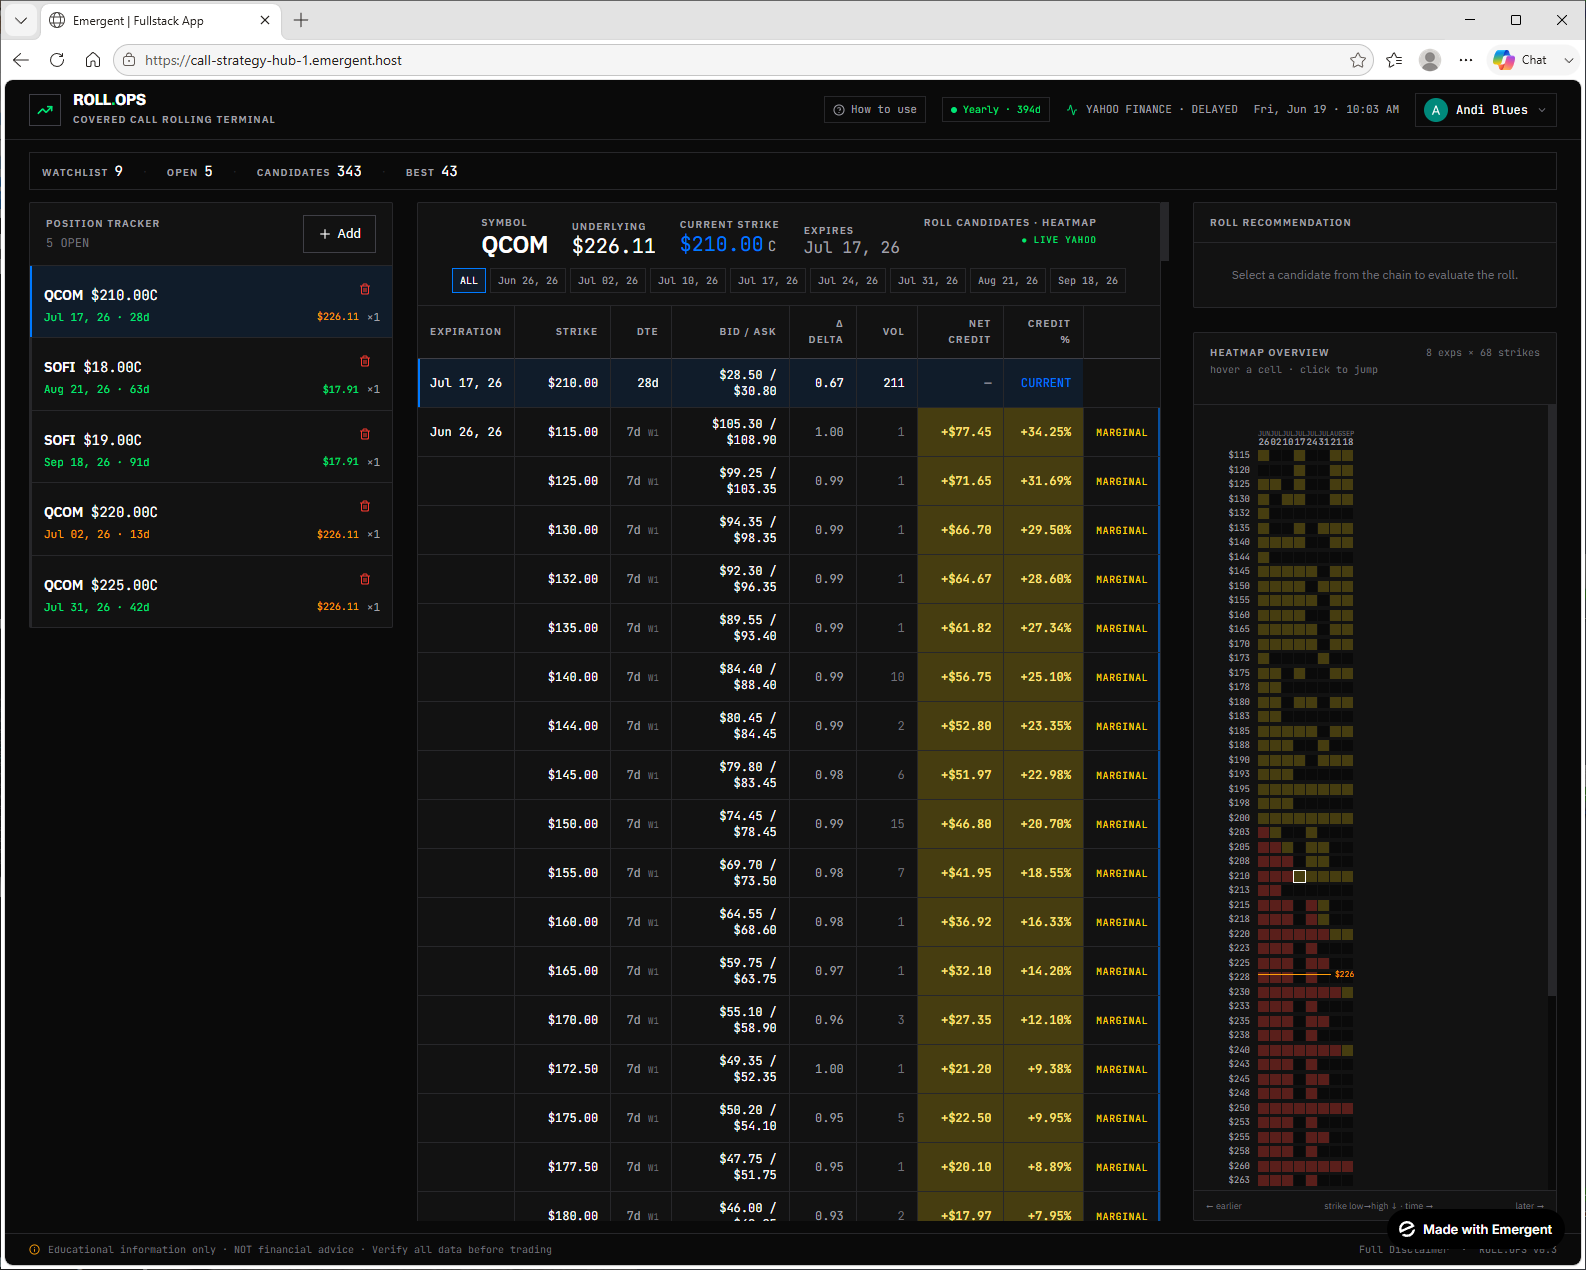
Roll Candidates
Every roll target, color-coded
Your positions on the left, a full option chain in the middle ranked by net credit and credit %, and a heatmap on the right — all color-coded so the best rolls are obvious at a glance.
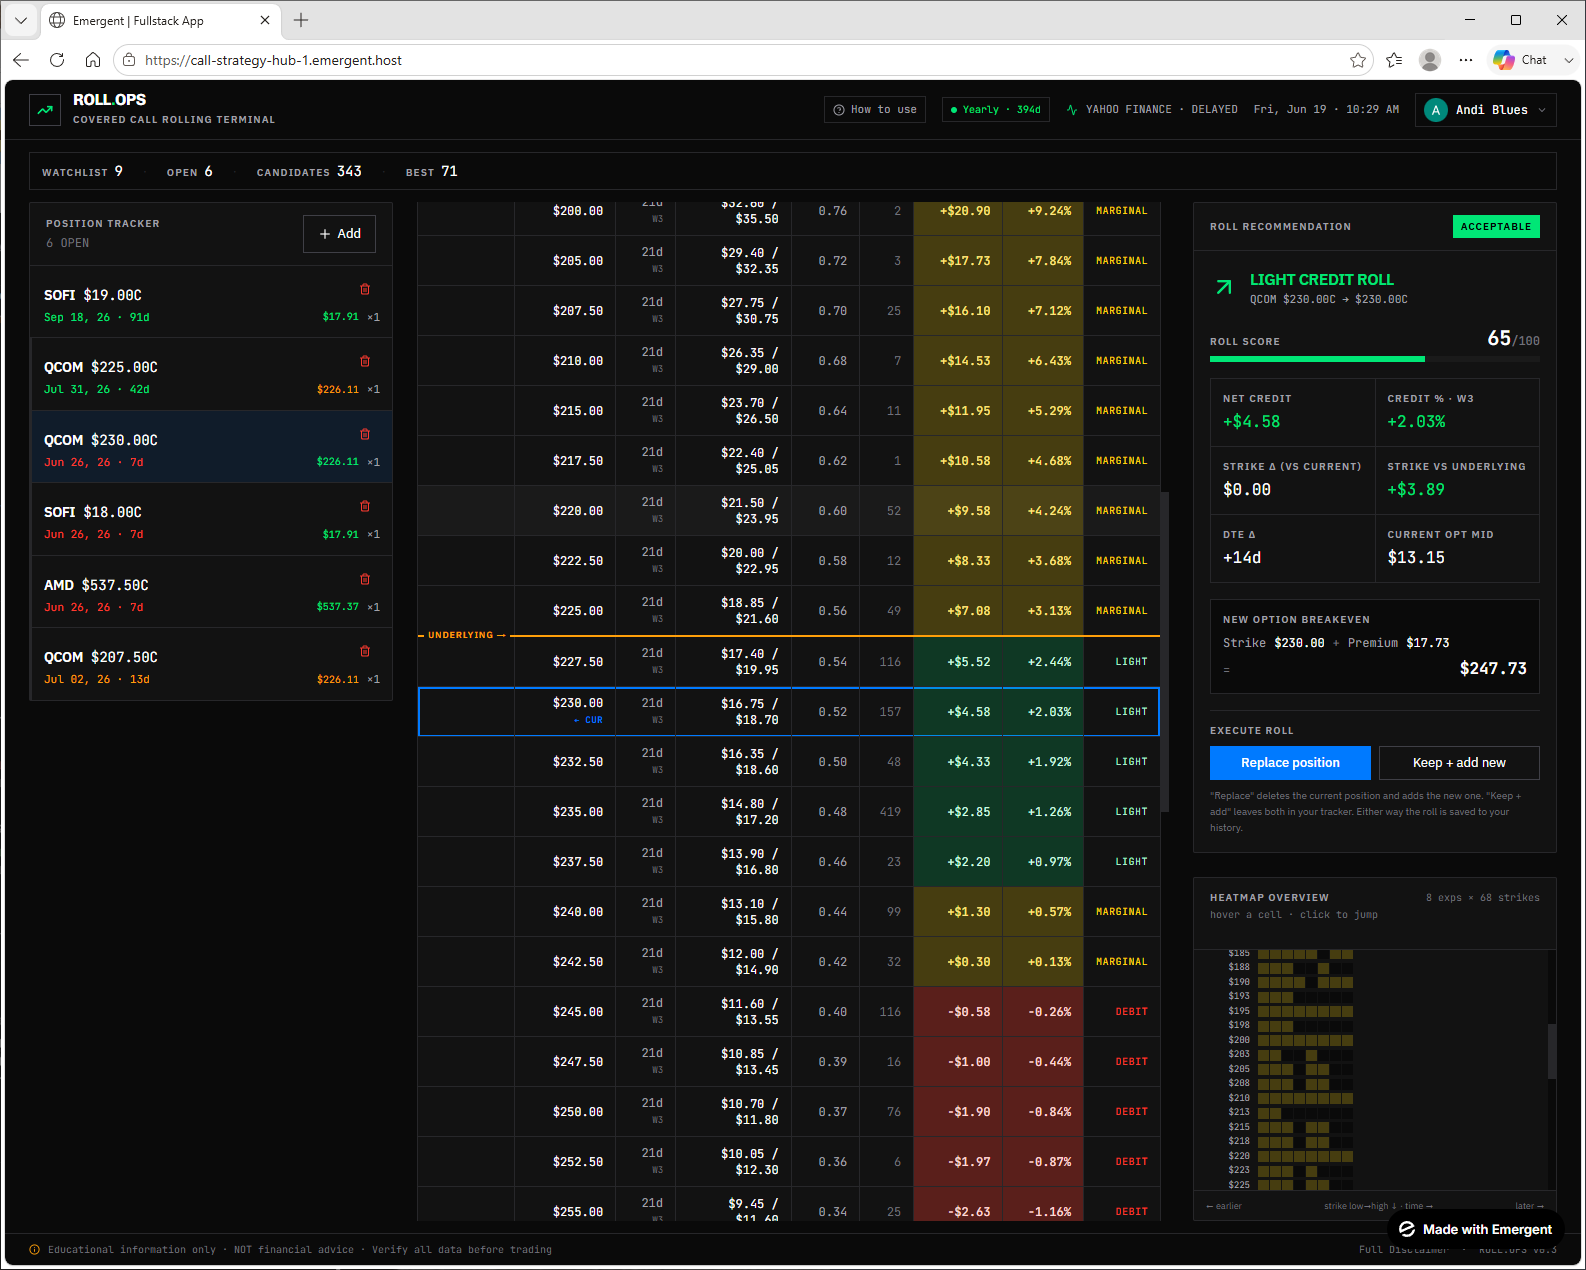
Roll Recommendation
The full picture before you act
Pick a candidate and get a roll score, net credit, strike-vs-underlying, DTE change and a fresh breakeven — then replace your position or keep both for side-by-side analysis.
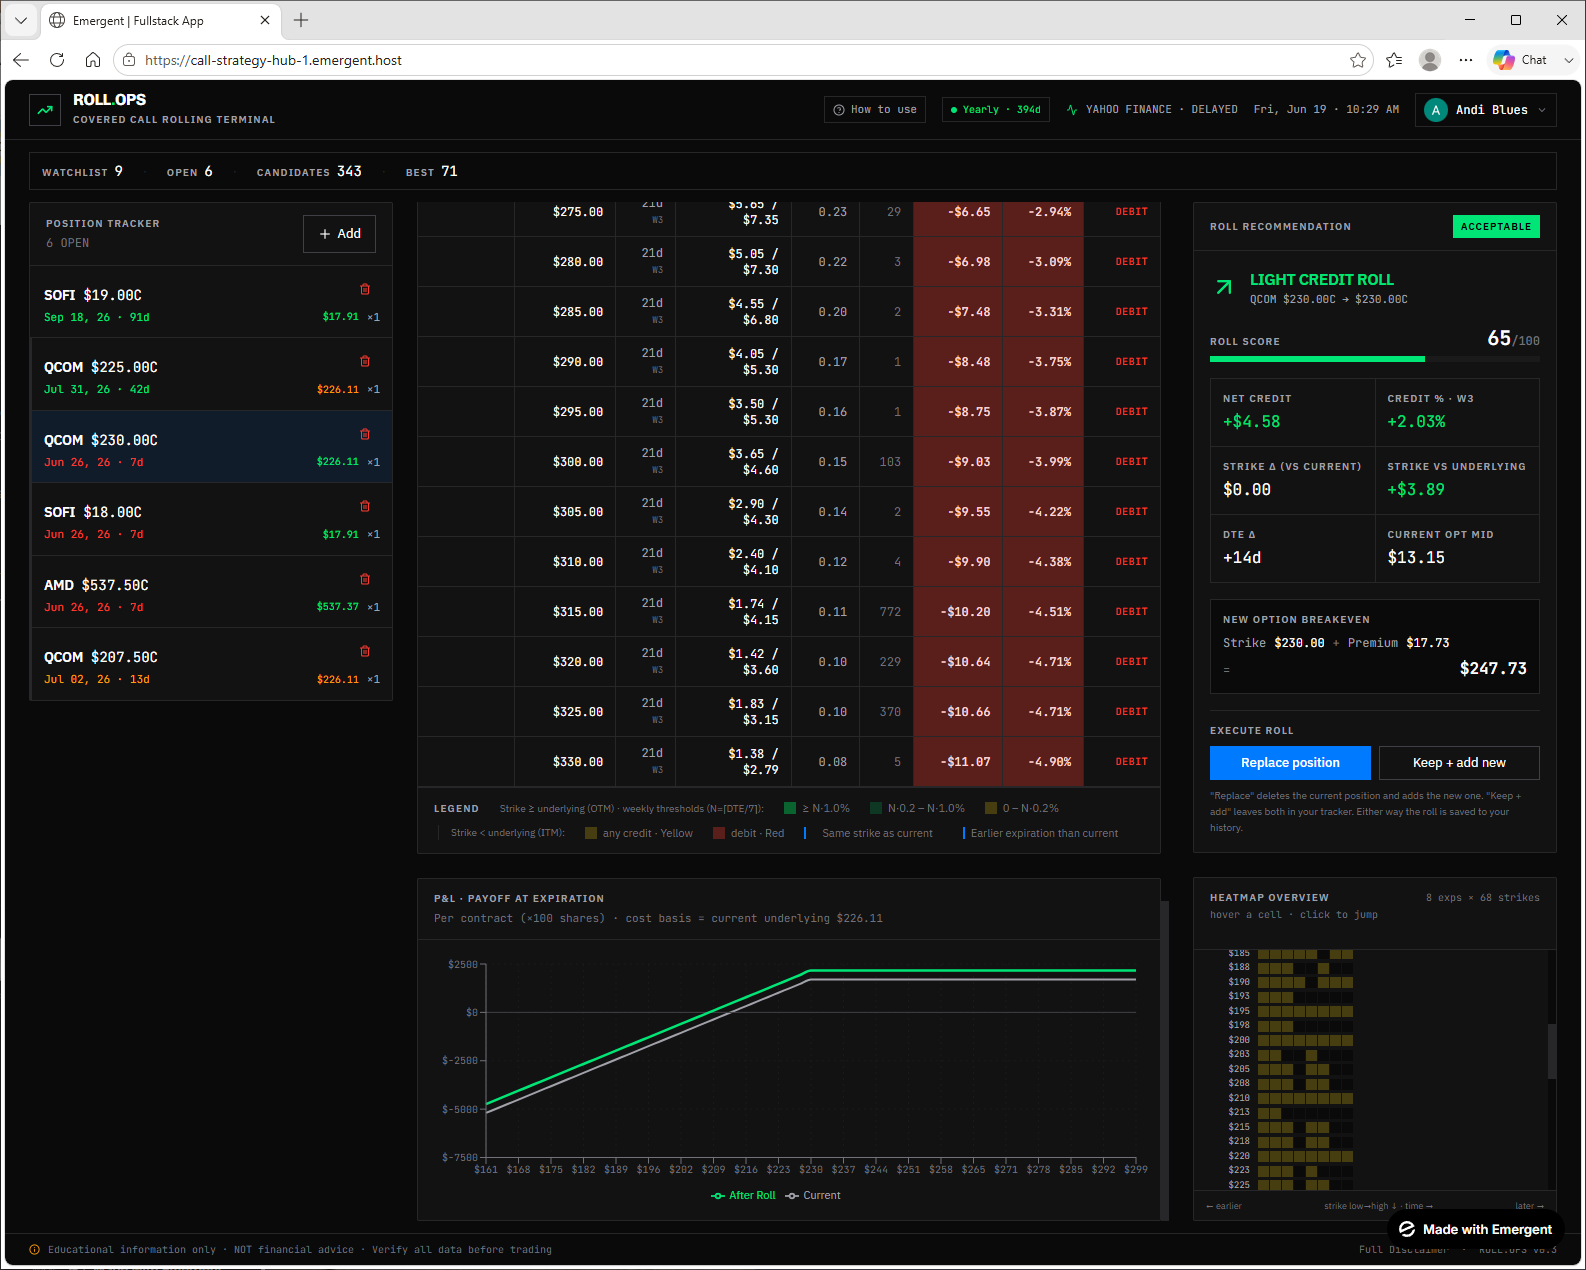
Payoff Comparison
See before vs. after at expiration
A P&L payoff chart overlays your current position against the rolled position across the underlying's price range, so you can confirm the roll actually improves your outcome.
/ Step-by-step
From sign-in to your first roll.
Six steps to go from a fresh login to tracking real premium — including how to read the color-coded roll candidates. Follow along here, then open the terminal and do it for real.
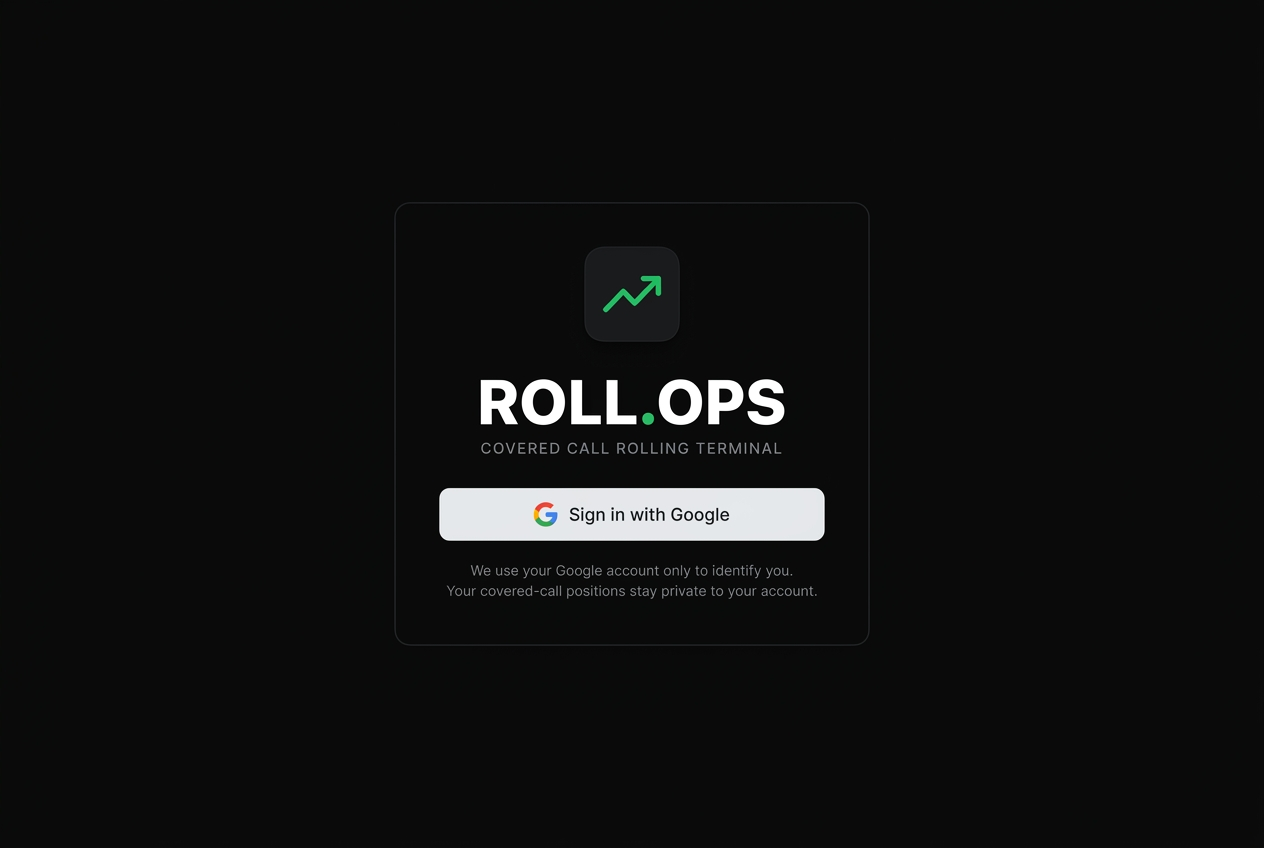
Open & sign in with Google
Click any 'Open ROLL.OPS' button to launch the terminal, then authorize with one-click Google sign-in. Your private workspace loads instantly — this matches the actual ROLL.OPS sign-in screen.
Add your positions manually
ROLL.OPS never links to your bank or broker. As an educational tool we deliberately keep your money and login credentials out of reach — you stay in full control. In the Position Tracker, hit '+ Add', pick the ticker, expiration, strike and contracts, then Save Position.
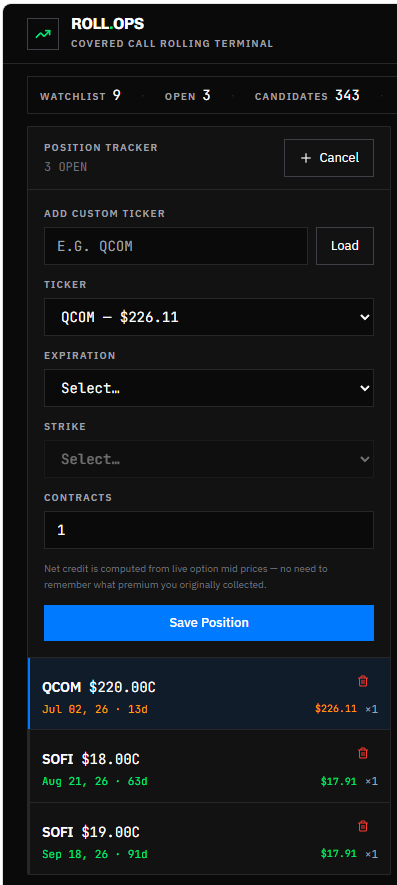
Click a position to analyze
Once saved, every position appears in the Position Tracker — and it's color-coded at a glance. Click the one you want to work on and ROLL.OPS opens the full roll-analysis view for it.
Expiration date — time left
Within 1 week — expiring soon, act now.
Within 2 weeks — start planning your roll.
More than 2 weeks out — no rush.
Premium — strike vs. current price
Strike is above the current price — out of the money, shares safe.
Strike is below the current price — in the money, assignment risk.
Read the roll candidates
This is the heart of ROLL.OPS. Every available roll target is laid out and color-coded against two goals: (1) collect a net credit, and (2) move your strike above the underlying price so your shares aren't called away. The heatmap on the right uses the very same colors as the table, so the best zones jump out instantly.
Everything in 'Ideal', and the premium yields more than 1% per week — the strongest rolls on the board.
Both goals met — you collect a credit AND the new strike sits above the underlying price, so your shares stay safe from assignment.
You still earn a positive premium, but the strike is below the underlying price — your shares could still be called away.
You'd have to pay to make this roll — the net credit is negative.
Real market data — Quotes come live from Yahoo Finance on a ~15-minute delay — note the 'YAHOO FINANCE · DELAYED' tag up top. Analysis uses your real inputs, never fake data.
Position Tracker — Left column — your saved positions. The selected one drives the whole analysis.
Symbol header — Top-center — symbol, live underlying price, the current strike of the selected expiration, and days to expiry.
Expiration tabs — Switch between candidate expirations, or view ALL at once.
Candidates table — Bid/ask, delta, volume, net credit and credit % for every target — color-coded by the rules above.
Heatmap — Right side — a grid of expirations × strikes to spot the green zones at a glance.
Roll Recommendation — Click any candidate to evaluate that specific roll in detail.
Select your roll & record it
Pick the candidate you want to roll into — click any row in the table, or a cell in the clickable heatmap. The Roll Recommendation panel fills in with every detail. ROLL.OPS never sends the order — you place the actual trade in your own brokerage, then record the outcome here.
Select a candidate — Click a row in the table or a cell in the heatmap — both jump to the same roll.
Roll Recommendation — Fills with roll score, net credit, credit %, strike vs underlying, DTE change and the new breakeven.
Replace position — Deletes the current position and saves the new one in its place.
Keep + add new — Leaves both in your tracker — great for comparing scenarios side by side.
Saved to history — Either choice records the roll, so you build a running log of what you did.
You execute it — Place the real order in your own brokerage — ROLL.OPS never trades for you.
Compare before vs. after
Scroll to the P&L · Payoff at Expiration chart to see the whole picture: your current position versus the position after the roll, plotted across the underlying's price range. It's the clearest way to confirm a roll actually improves your outcome before you place it.
After Roll (green) — Your projected payoff if you take this roll — at a glance you see the upside shift.
Current (white) — Your existing position's payoff, for a direct side-by-side comparison.
Per contract — Plotted per contract (×100 shares) using your current underlying as the cost basis.
Full color legend — The chain legend spells out every threshold — bright green for the strongest weekly yields down to red debits.
Logged to history — Replace or keep-and-add saves the roll as an individual entry in your history — a log of each move, experiments included, not a running total.
/ FAQ
Common questions.
Quick answers for getting started and understanding what ROLL.OPS does — and doesn't — do.
/ Ready when you are
Open the terminal and roll your first call.
You've seen how it works. Launch ROLL.OPS, sign in with Google, and put your covered call strategy on autopilot.